

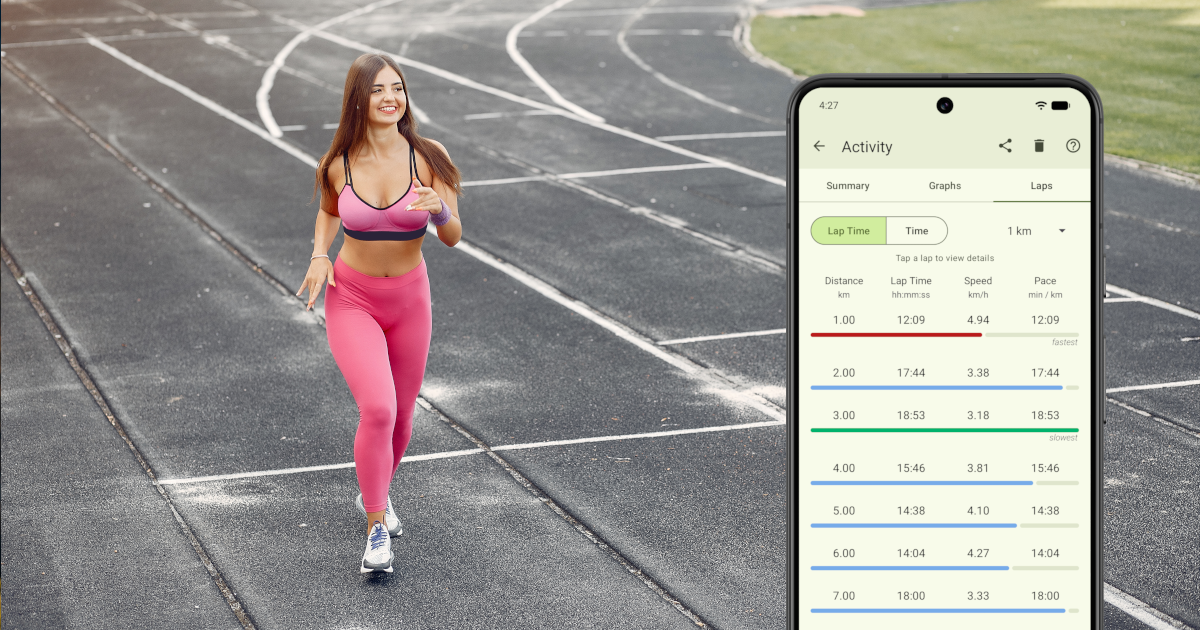
An overall average can hide the most interesting parts of an activity.
You may complete a route at an average pace of six minutes per kilometre, but that single number does not show whether you maintained a steady effort, started too quickly, slowed on a climb or finished strongly.
Distance splits divide an activity into consistent sections, such as every kilometre or mile. Comparing those sections can reveal how your pace, speed and effort changed from the beginning of the route to the end.
| Splits show directly | What requires additional context |
|---|---|
| Time, pace and speed for each section | How much physical effort the section required |
| Where performance changed | Why the change occurred |
| Whether pacing was consistent | The influence of terrain, wind, stops and GPS accuracy |
Without measurements such as heart rate or cycling power, splits do not measure effort directly. They show changes in performance that can be interpreted alongside the route, elevation and conditions.
What is a distance split?
A distance split is a section of an activity created after a fixed amount of distance has been covered.
Common examples include:
- Every 500 metres.
- Every kilometre.
- Every mile.
- Every two kilometres.
- Every five kilometres.
If an activity covers 5.4 kilometres using one-kilometre splits, it can be divided into:
- Five complete one-kilometre splits.
- One final partial split of 400 metres.
Each split can contain measurements such as:
- Split duration.
- Average pace.
- Average speed.
- Accumulated distance.
- Elevation changes.
- Estimated calories.
- Other activity-specific statistics.
The same split distance is applied repeatedly, making neighbouring sections easier to compare.
For the broader process that produces the route, distance and timing data used by splits, read What is a GPS activity tracker and how does it work?.
What is the difference between a lap and a split?
The words lap and split are sometimes used interchangeably, but they can describe different ways of dividing an activity.
A distance split is generated automatically from a fixed distance. For example, the tracker may create a new section after every kilometre.
A lap can represent a section chosen for a particular reason, such as:
- One interval.
- One climb.
- One loop around a course.
- A recovery section.
- A specific part of a route.
- A manually marked training segment.
The distinction depends on the application. Some trackers present automatically generated distance sections under a general Laps screen.
Both methods have the same broad purpose: breaking a complete activity into smaller sections that can be analysed separately.
Why an overall average is not enough
An average combines the entire activity into a single result.
Suppose you cover six kilometres in 36 minutes. The overall pace is six minutes per kilometre.
That average could come from six identical splits:
| Split | Pace |
|---|---|
| 1 km | 6:00/km |
| 2 km | 6:00/km |
| 3 km | 6:00/km |
| 4 km | 6:00/km |
| 5 km | 6:00/km |
| 6 km | 6:00/km |
It could also come from a much less consistent activity:
| Split | Pace |
|---|---|
| 1 km | 5:10/km |
| 2 km | 5:25/km |
| 3 km | 5:50/km |
| 4 km | 6:10/km |
| 5 km | 6:35/km |
| 6 km | 6:50/km |
Both activities have the same total duration and average pace. The splits tell very different stories.
The first activity remained steady. The second began quickly and slowed throughout the route.
Without distance splits, that difference is hidden inside the average.
Look for consistency between neighbouring splits
Start by comparing splits that cover similar terrain.
Small differences usually indicate a relatively steady activity. Larger differences deserve more context.
A slower split may contain:
- A climb.
- A headwind.
- A road crossing.
- Congestion on the route.
- Difficult terrain.
- A brief stop that was not paused.
- Increasing fatigue.
A faster split may contain:
- A descent.
- A tailwind.
- A smoother surface.
- A deliberate increase in effort.
- A strong finish.
A single unusual split does not automatically indicate a problem. Its location on the route often explains the result.
Splits can reveal pacing strategy
Distance splits can show how pacing changed throughout an activity. The terms positive split, negative split and even split usually compare the first and second halves of the complete activity, while the individual distance splits show how that pattern developed.
Positive split
A positive split means the second half of the activity was slower than the first half.
The individual splits may show a gradual slowdown, a sudden change or one particularly difficult section.
Possible reasons include:
- The activity began too quickly.
- Fatigue accumulated.
- Temperature increased.
- The second half contained more climbing.
- Nutrition or hydration became insufficient.
- A headwind affected the return route.
A positive split is not automatically a pacing mistake. The second half may simply contain more difficult terrain or conditions.
Negative split
A negative split means the second half was faster than the first half.
The individual splits may show a controlled progression or a stronger final section.
Possible reasons include:
- A controlled start.
- A gradual warm-up.
- Increasing confidence.
- Easier terrain later in the route.
- A planned strong finish.
- A tailwind or descent.
A negative split may indicate controlled pacing, but terrain, wind and stops must still be considered.
Even split
An even split means the first and second halves were completed in approximately the same time.
Individual distance splits can provide more detail by showing whether the pace remained consistently steady or whether faster and slower sections happened to balance one another.
Small differences are normal because terrain, turns, GPS measurements and conditions are rarely identical throughout an outdoor activity.
Compare like with like
A split is most useful when compared with another section under similar conditions.
A flat kilometre should not be judged in the same way as a steep climb. A sheltered road section will not necessarily match an exposed ridge in strong wind.
Before interpreting a slower or faster split, consider:
- Elevation.
- Surface type.
- Wind direction.
- Intersections and crossings.
- Trail difficulty.
- GPS accuracy.
- Temperature and humidity.
- Whether the section included a stop.
The number shows what happened. The route and surrounding conditions help explain why.
For more context about wind, temperature, precipitation and other environmental factors, read What weather conditions should you check before an outdoor activity?.
Split time, pace and speed describe related information
A split can be displayed through several measurements.
Split time
Split time shows how long it took to complete the section.
For a fixed split distance, a shorter duration means the section was completed faster.
This is the most direct comparison when all complete splits cover the same distance.
Pace
Pace describes how much time was required to cover a unit of distance.
It is commonly displayed as:
- Minutes per kilometre.
- Minutes per mile.
A lower pace value represents faster movement.
For example:
- 5:20/km is faster than 6:10/km.
- 9:00/mi is faster than 10:30/mi.
Speed
Speed describes the amount of distance covered during a unit of time.
It may be displayed in:
- Kilometres per hour.
- Miles per hour.
A higher speed represents faster movement.
Pace is commonly used for running, walking and trekking. Speed is often more intuitive for road cycling, mountain biking and touring.
Both describe the same movement from different perspectives.
Why the final split may be shorter
Most activities do not finish at an exact multiple of the selected split distance.
A 7.3-kilometre activity using one-kilometre splits contains:
- Seven complete splits.
- One final 300-metre split.
The final section should not be compared directly by duration with the full-distance sections. It covers less distance, so its time will naturally be shorter.
Pace or speed provides a normalized measurement, but short partial splits can still be more sensitive to:
- GPS fluctuations.
- Rapid changes near the finish.
- The exact point where recording stopped.
- A final stationary period.
- Very little data compared with a full split.
A partial split remains useful because it accounts for the complete activity, but it should be interpreted separately from complete splits.
Why the fastest and slowest split matter
Highlighting the fastest and slowest complete splits makes large changes easier to identify.
The fastest split may represent:
- The strongest sustained effort.
- A downhill section.
- A favourable wind.
- Smooth or open terrain.
- A deliberate finishing push.
The slowest split may represent:
- A significant climb.
- Fatigue.
- A stop.
- Difficult terrain.
- Poor GPS conditions.
- A section affected by weather.
These indicators are starting points for analysis, not automatic judgments about performance.
A slow split on the steepest climb may represent excellent effort. A fast downhill split does not necessarily mean effort was greater than during a slower climb.
Open the matching route segment
A table of numbers cannot always explain why a split changed.
Viewing the corresponding section on the map can reveal:
- A climb or descent.
- A sharp turn.
- A road crossing.
- A route through buildings.
- A forested section.
- A technical trail.
- A stop near a landmark.
- A GPS jump or missing section.
VMFit can highlight an individual lap or split on the recorded route. This connects the split statistics with the place where they occurred.
The map is especially useful when a change appears in only one section. If several neighbouring splits become gradually slower, the cause may be fatigue or a sustained climb. If one split differs sharply, a local interruption or GPS problem may be more likely.
How elevation affects splits
Elevation can change the relationship between pace and effort.
A slower uphill split may require more effort than a faster flat section. A fast descent may require less cardiovascular effort even though the recorded pace or speed is higher.
When analysing a hilly activity, look for patterns such as:
- Pace slowing as elevation rises.
- Speed increasing during descents.
- A delayed slowdown after a difficult climb.
- Strong performance on repeated climbs.
- Different results on exposed and sheltered sections.
For hiking and trekking, terrain difficulty may matter as much as elevation. Rocky ground, mud or steep switchbacks can reduce speed even when the elevation profile appears moderate.
How stops affect split results
A stop can increase the time of the split in which it occurred.
Common examples include:
- Traffic lights.
- Road crossings.
- Navigation checks.
- Water breaks.
- Equipment adjustments.
- Waiting for another participant.
- Taking photographs.
Whether the stop affects the split depends on how the tracker handles timing.
If the workout remains active, the stopped period may increase the split duration and reduce average speed or pace.
If auto-pause or manual pause is used, some or all of the interruption may be excluded from the active timing.
This is why split comparisons should be considered alongside elapsed time and moving time.
GPS accuracy can change individual splits
Distance splits depend on the recorded route, so inaccurate location measurements can affect where each split begins and ends.
GPS errors may cause:
- A split boundary to occur too early or too late.
- Extra distance from side-to-side drift.
- Missing distance when corners are cut.
- A false speed change.
- An unusual final partial split.
- Different split results between devices or applications.
One irregular split does not necessarily represent a real change in effort.
Review the route when a result appears implausible. A visible jump, shortcut or unstable section may explain the difference.
For a detailed explanation, see How accurate is phone GPS for outdoor activity tracking?.
Choosing a useful split distance
The most useful split distance depends on the activity and its total length.
Short splits
Examples include 500 metres or half a mile.
Short splits reveal more detail and can show brief changes in pace or speed. They may be useful for:
- Short routes.
- Intervals.
- Repeated efforts.
- Urban activities with frequent changes.
- Analysing individual climbs or sections.
The disadvantage is greater sensitivity to GPS noise, corners and short stops.
Medium splits
Examples include one kilometre or one mile.
These provide a practical balance between detail and stability. They are suitable for many outdoor activities and make neighbouring sections easy to compare.
Long splits
Examples include two or five kilometres.
Longer splits smooth out brief fluctuations and may be more useful for:
- Long-distance cycling.
- Touring.
- Extended hikes.
- Endurance activities.
- Reviewing broad changes across a long route.
They provide less detail but can make overall pacing trends easier to see.
There is no universally correct distance. Choose one that creates enough sections to reveal a pattern without dividing the activity into excessively small fragments.
Comparing splits across repeated routes
Splits become especially useful when the same route is recorded more than once.
You can compare:
- Whether the first section became more controlled.
- Whether a familiar climb was completed faster.
- Where fatigue normally begins.
- Whether performance remained steadier.
- How wind or weather changed the result.
- Whether a route modification affected total effort.
For a fair comparison, use:
- The same split distance.
- Similar timing settings.
- The same unit system.
- Similar start and finish points.
- The same definition of active or moving time.
Environmental differences should still be considered. A faster result in favourable wind is not directly equivalent to the same result in difficult conditions.
Splits for different outdoor activities
Road cycling
Road cyclists can use splits to identify:
- Changes caused by headwinds and tailwinds.
- Sustained climbs.
- Fast descending sections.
- Loss of speed late in a ride.
- Differences between outbound and return legs.
Longer split distances may be more useful because cycling covers distance quickly.
Mountain biking
Mountain-bike splits can reveal:
- Technical sections.
- Difficult climbs.
- Fast descents.
- Terrain that repeatedly reduces speed.
- Differences between trail surfaces.
Short sections should be interpreted carefully because turns, tree cover and slow technical movement can affect GPS accuracy.
Hiking and trekking
For hiking, splits can show:
- How climbing changed movement speed.
- Where terrain became difficult.
- How long exposed or technical sections took.
- Whether progress slowed later in the route.
- How rest stops affected the activity.
Elapsed time and available daylight may remain more important than maintaining a fixed pace.
Running
Running splits are commonly used to review pacing consistency, progressive effort and the effect of hills or road crossings.
A sequence of gradually slower splits can suggest an aggressive start, but only after terrain and stops have been considered.
Walking
Walking splits may help compare repeated routes, sustained pace and environmental effects. Slow movement makes accurate stop detection more difficult, so aggressive auto-pause settings can influence the result.
Do faster splits always mean greater effort?
No.
Speed and pace are outcomes affected by many factors. Effort is influenced by:
- Gradient.
- Wind.
- Surface.
- Temperature.
- Fatigue.
- Load carried.
- Technical difficulty.
- Recovery from previous sections.
A slower climb may require more effort than a fast descent. A loaded hike may be more demanding than a faster walk on a flat surface.
Without measurements such as heart rate or power, splits cannot measure effort directly. They provide evidence that can be interpreted with the route and conditions.
That is why the article refers to what splits reveal about effort rather than treating pace as a complete measurement of effort.
How VMFit presents distance splits
VMFit can divide completed GPS-tracked activities into configurable distance sections.
Available split distances can include metric or corresponding imperial options, depending on the selected unit system.
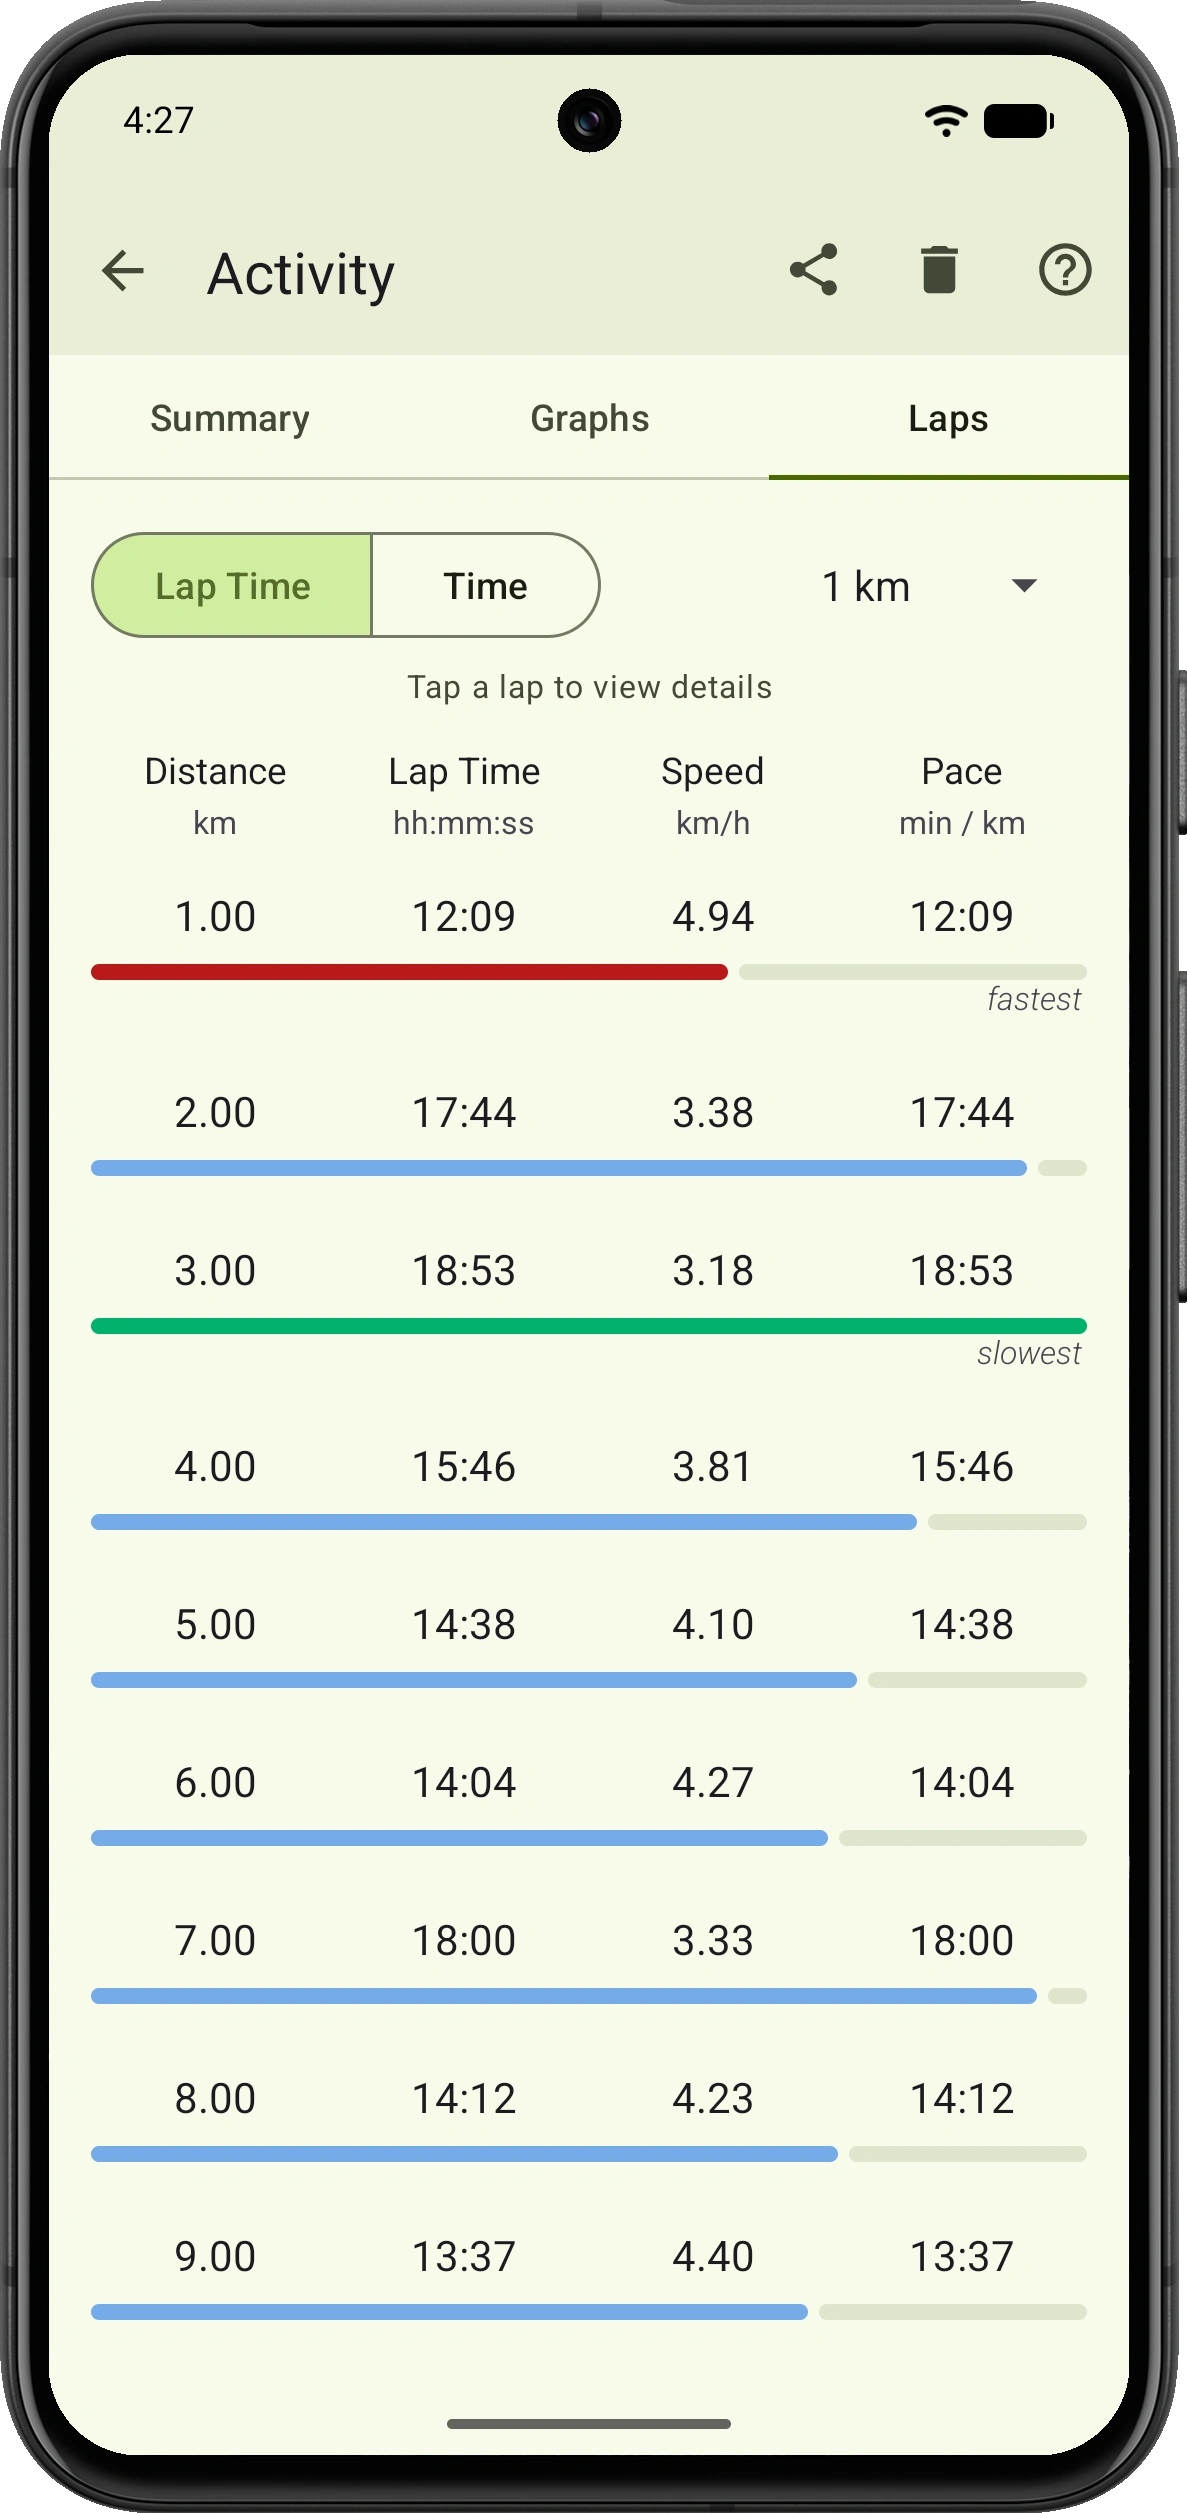
The Laps view can display information such as:
- Accumulated distance.
- Lap or split time.
- Speed.
- Pace.
- Fastest and slowest complete sections.
- A final partial section when distance remains.
An individual section can be opened to review more detail and relate its statistics to the highlighted part of the recorded route.
This makes it possible to move from asking “Where did my pace change?” to asking “What happened on that part of the route?”
Splits can also be considered alongside activity graphs, elevation, timing and environmental conditions for a more complete interpretation.
A practical way to review an activity
Use the following sequence after completing a route:
- Check the total distance and duration.
- Review the overall pace or speed.
- Compare neighbouring complete splits.
- Identify the fastest and slowest sections.
- Open any unusual split on the map.
- Check the elevation and terrain.
- Consider stops, weather and wind.
- Compare the pattern with previous activities on a similar route.
This prevents one number from being interpreted without context.
Frequently asked questions
What is a distance split?
A distance split is an automatically created section of an activity based on a fixed distance, such as every kilometre or mile.
What does split pace mean?
Split pace is the average pace calculated for one section of the activity rather than for the complete route.
Why is my final split shorter?
The activity ended before another full split distance was completed. The remaining distance is shown as a partial split.
Should a partial split be compared with complete splits?
Not by duration alone. It covers less distance. Pace or speed allows a more useful comparison, but very short partial sections may still be less stable.
Why was one split much slower?
The section may contain a climb, stop, headwind, difficult terrain or inaccurate GPS measurements. Open the corresponding route segment for context.
Are distance splits the same as manual laps?
Not always. Distance splits are generated automatically at fixed intervals, while manual laps can represent sections chosen by the user.
Which split distance should I use?
Use shorter splits for more detail and longer splits for broader trends. One kilometre or one mile provides a useful balance for many activities.
Can splits show effort?
Splits can reveal changes in pace, speed and timing that may reflect changes in effort, but they do not measure effort directly. Terrain, elevation, wind, stops and GPS accuracy must also be considered.
Why do two apps produce different splits?
They may calculate distance, timing, pause periods and GPS filtering differently.
Does VMFit show the route for an individual split?
Yes. VMFit can highlight the corresponding route section for an individual lap or split.
Conclusion
Distance splits turn one overall activity average into a sequence of comparable sections.
They can reveal whether movement remained consistent, where pace or speed changed, how terrain affected the result and whether performance declined or improved later in the route.
The numbers are most useful when interpreted together with the map, elevation, timing, GPS accuracy and outdoor conditions.
VMFit combines split statistics with the matching route segment, helping connect performance changes with the place where they occurred.